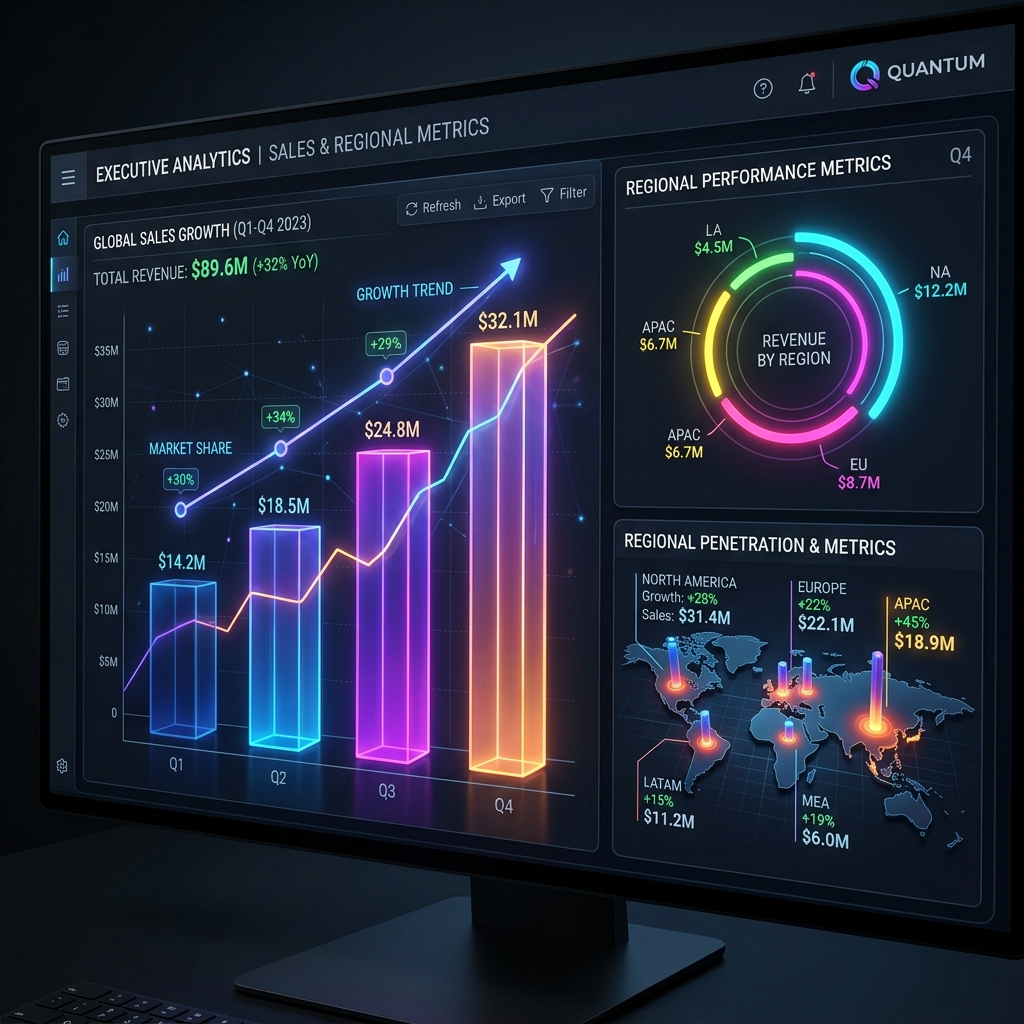
Sales Data Analytics Dashboard
Data-driven clarity for executive decision making.
- Real-time Revenue Tracking
- Regional Sales Heatmaps
- Predictive Trend Analysis
The Challenge
Lack of real-time visibility into sales performance across different regions made it difficult for leadership to make timely data-driven decisions.
Our Process
Strategic execution focused on scalability, data integrity, and high-performance user experiences tailored specifically to the project needs.
The Impact
Management now has instant access to KPIs, reducing the time spent on monthly reporting by over 80%.
Tech Mastery
Technical Stack
Backend
Python
Data Science
Pandas
Visualization
D3.js
Warehouse
Snowflake
BI Tool
Tableau
Phase By Phase
Development Lifecycle
Execution Excellence
Data Audit
Mapping all regional data sources and identifying quality issues.
Pipeline Dev
Building a scalable Snowflake-based data warehouse.
Visualization
Designing intuitive D3.js components for clear data storytelling.
Automation
Scheduling automated report generation for stakeholders.
Critical Challenges
Issue 01
Data latency from regional disparate databases.
Issue 02
Inconsistent data entries from legacy POS systems.
Applied Solutions
Resolution 01
Optimized ETL pipelines using Snowflake's streaming ingestion capabilities.
Resolution 02
Built an automated data cleaning layer using Python to normalize incoming entries.
Strategic Solace
Engineered for Resolution
Our approach wasn't just about writing code; it was about solving fundamental business friction points through architectural integrity and innovative digital engineering.
100%
Deployment Accuracy
0
Critical Vulnerabilities
80% reduction in reporting time
Real-time visibility into global sales trends
Improved inventory forecasting accuracy by 15%
Core Capabilities
Platform Powerhouse
Real-time Revenue Tracking
Regional Sales Heatmaps
Predictive Trend Analysis
Customizable Export Layouts
Common Questions About This Project
We believe in complete transparency. Here are the most common questions our clients ask about this specific project and our delivery methodology.
Yes, users can drag and drop widgets to create personalized dashboard views for their KPIs.
Ready To Scale Your
Business Success?
Join 100+ global enterprises that trust Net-Change for technical depth and cloud innovation.